

As the playoffs near, I’ve been thinking about the title contenders and what it would take for one of them to become the 27th champion in the WNBA’s history. As the Las Vegas Aces look as poised as ever to become just the third team in league history and the first since the 2002 Los Angeles Sparks to repeat, I asked myself which I’d rather have come playoff time—a star player or a team full of depth? In the men’s league, star power usually shines, as players like LeBron James, Giannis Antetokounmpo, Michael Jordan, and Bill Russell willed their teams to championships on the backs of their elite-level play. I wondered if the same applied to the W and set out to find my answer.
The History and the Metric
In the W’s 26-year history, there have been 172 playoff series, including 29 single-game series and 143 multi-game series. Of those 172 series, 125 of them (or 72.6 percent) were won by the better seed. This didn’t entirely surprise me, but it didn’t reveal the answer I was looking for.
I decided that I needed to find the right statistic to measure the value a player adds to their team in the playoffs. I found plenty of basketball analytics websites to choose from, and in the end, I settled on Inpredictable and their win probability added (WPA) metric. While I could have used wins above replacement, the WNBA Dashboard that houses that metric only gave me regular season data. I could have borrowed a men’s league metric like LEBRON that, as explained by bball-index, “evaluates a player’s contributions using the box score and advanced on/off calculation.” But that would have only gone back to 2017. WPA—a catch-all for the wins a player adds or subtracts based on made/missed shots, getting fouled, turnovers, and made/missed free throws—felt like the best choice to capture the true value a player offers. Further, I chose their “kitchen sink” WPA (kWPA), as this also includes rebounds, blocks, assists, and steals in addition to a player’s WPA. This felt like the most holistic way to evaluate whether a star player or a depth team was more valuable during the postseason.
The Data
Rather than going through the pain-staking process of analyzing every playoff team and series ever, I decided to explore the champions from each season in addition to the runners-up. This gave me two data points for each season with plenty of games played for each of those teams. Before we get into the data, an important caveat: The kWPA data is based on total kWPA, not kWPA per game. I made this decision to help illuminate the values between the players because I felt as though the smaller per game numbers might skew the understanding of how variable some of the players on a team actually are.
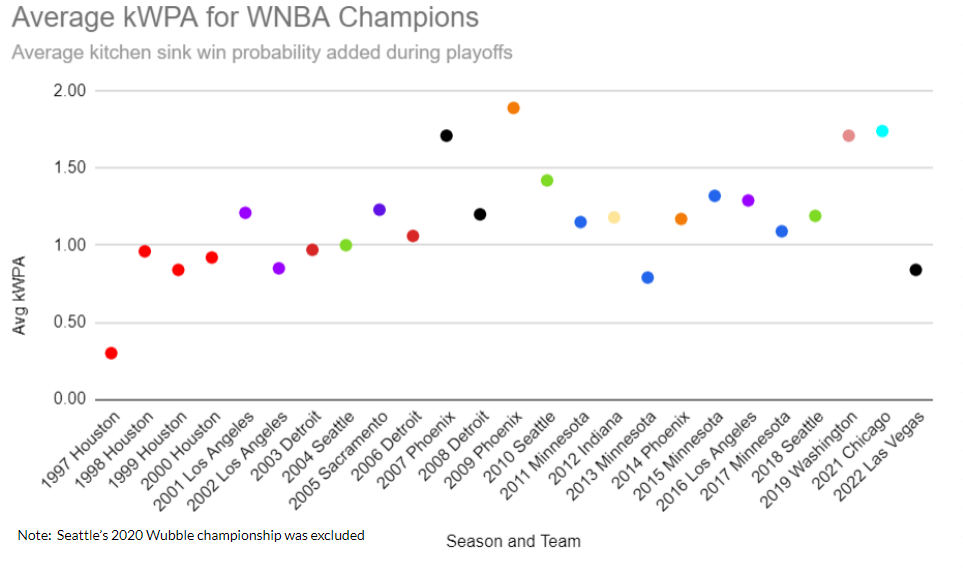

Above are two graphs—the average kWPA for each WNBA champion and the runners-up. Note the similarity in the numbers, which should not surprise you. These were the two best teams come each season’s end, and their average kWPA of players on their teams reflects just that.
I then calculated the average kWPA for all of the championship teams and the average kWPA for all of the runners-up. What I found was the average kWPA per championship team was 1.16 kWPA, while the runners-up were narrowly behind with a 1.13 kWPA. What this told me was both the champions and the runners-up had teams that averaged over a win added as a team. This didn’t differentiate much for me just yet, but it did give me a baseline for how to break down the subsequent data.
The Tiers
I turned now to looking at the kWPA of individual players rather than teams. I made the baseline for any contributing player be 1.15 kWPA to keep the math easy. Therefore, a player who averaged north of 2.0 kWPA was considered a tier-one player, an elite and incredibly valuable player to their team. Tier-two players were those within a certain standard deviation around that 1.15 baseline. I chose 0.75 on the low side and 1.99 on the high, making them the second tier. Lastly, the third tier of players consisted of the below-average players who had a 0.74 or lower kWPA for their teams. This allowed me to rank and categorize players to see what type of players composed each team’s roster.
The Findings
What I found was especially intriguing. In looking at the top kWPA performer in each postseason, only 15 of them were on the eventual champion. This means that the brightest star was on the championship team only 58.0 percent of the time. This led me to believe that maybe having the top performer wasn’t a requirement for winning the championship, but I needed to explore more.
I needed to know the average number of players from each of the tiers on the championship teams versus the runner-up teams. Below is the data I found:
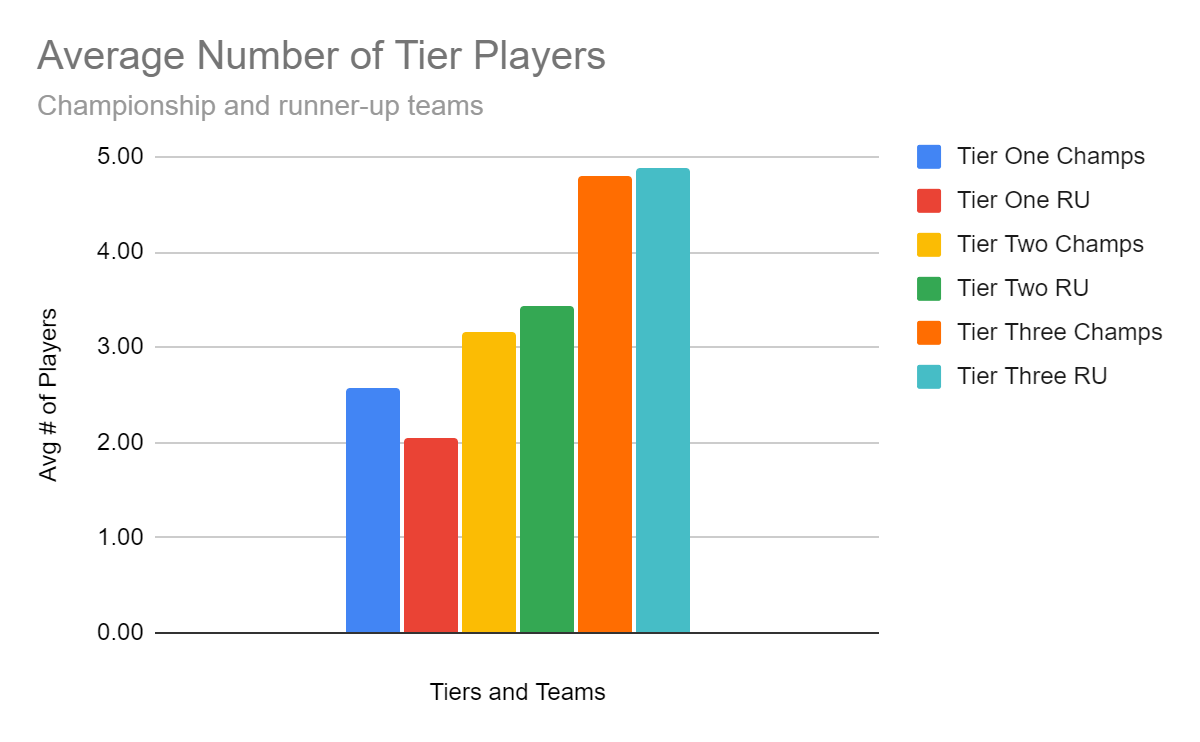
From the chart, what’s clear is championship teams have more tier-one players, while runner-up teams have slightly more tier-two players. This still wasn’t giving me a clear enough picture as to whether star power or depth is more valuable on a championship team, so I dove deeper.
Only four times in league history has a team won the championship having fewer tier-one players than the second-place team. That’s only 15.0 percent of the time. Additionally, 46.0 percent of the time, a team with fewer tier-two players has won the championship. What this tells me is that it’s far easier to win a championship if you have that elite-level, star player. Even if you don’t have the greatest bench, a team can still win the championship nearly half the time as long as they have some depth.
But what became clear was the importance of a well-rounded team. Each of those four championship teams who had fewer tier-one players than their runner-up had more tier-two players than their opponent. What this shows is that even if a team doesn’t have the most tier-one players, they can still get the job done. It still isn’t very likely at only 15.0 percent, but it is possible.
What was also interesting was looking further down the depth chart to see what combination of tier-two and tier-three players might make the difference. I found that a team with fewer tier-two and tier-three players than their opponent won the championship 11 times, or 42.0 percent of the championships in league history. When the champ had more in both tiers, they won 39.0 percent of the time. This shows me that the number of below-average contributors on a team wasn’t the deciding factor for championship success—tier-one and tier-two players made the difference.
For fun, I then decided to break down the data by position to see if there was a certain combination of players from certain positions that was preferable. I took the top-three kWPA players from each championship team and identified which position they played.

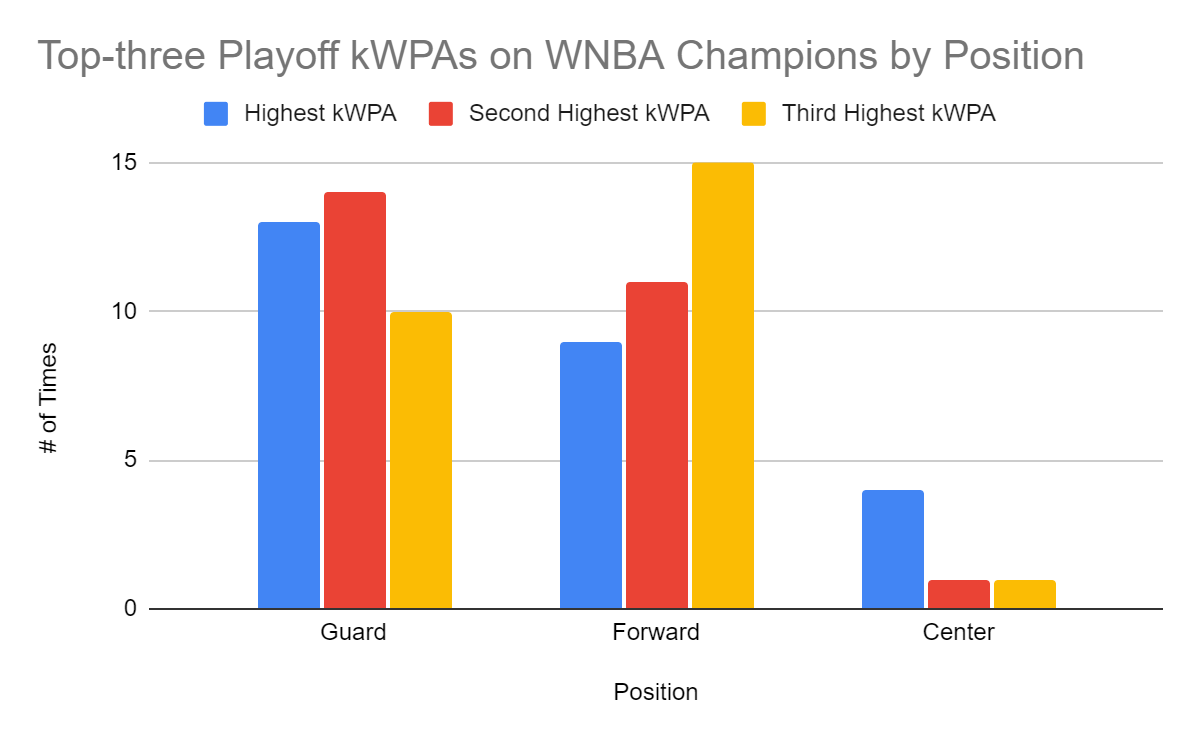
What’s evident from the chart above is for a team to be successful, a guard must be one of the top-two performers, and a forward should be the third-best performer. In fact, 50.0 percent of past champions had a guard as the top kWPA performer.
The Verdict
This data analysis indicates that in order to win the championship, you don’t need to have the highest performer of the postseason, but you do need to have elite talent on your team. If a team has at least two tier-one players, three tier-two players, and four tier-three players (obviously best if they’re contributing something over zero), then the team has an outstanding chance of winning the championship. If the team has a guard-guard-forward top-three kWPA structure, they’re even more likely to win, based on league history.
With all this analysis of the past in mind, looking at the 2023 regular season, which team is most likely to win the championship?
Since the regular season is much longer than the postseason, I needed to even out the bloated kWPA numbers from the regular season. Since every team has played their 40 games and most playoffs consist of around 10 games through the championship game, I decided to divide the 2023 regular season kWPAs by four to help make predictions.

The chart above has the five highest seeds in the regular season. If you recall the two-three-four structures from each of the tiers respectively, you can see that each of the top-five teams this season fit that mold precisely. Interestingly, New York, Connecticut, and Atlanta fit the two guards and forward format for their top-three kWPA performers (assuming you count DeWanna Bonner as a guard). What this tells me is the postseason is going to be intensely competitive, especially among the top five seeds. Having said that, Las Vegas has exceptional high-end talent throughout its lineup, so they are assuredly the outliers and are the current favorites to win the title.
In the end, if a team has only one star player who plays above the rest, there is a chance you can win. However, the data shows that if you have elite talent at a couple positions, and enough contributors in a couple of other spots down your roster, you’re more likely to take the crown.
All 2023 season stats are through Sept. 8. Unless otherwise noted, all data courtesy of stats.inpredictable.com.


